Part 1 helped you set a mission-aligned budget (see Mastering Nonprofit Budget Planning). Part 2 turned that plan into rolling forecasts and scenarios (see Forecasting & Scenario Planning).
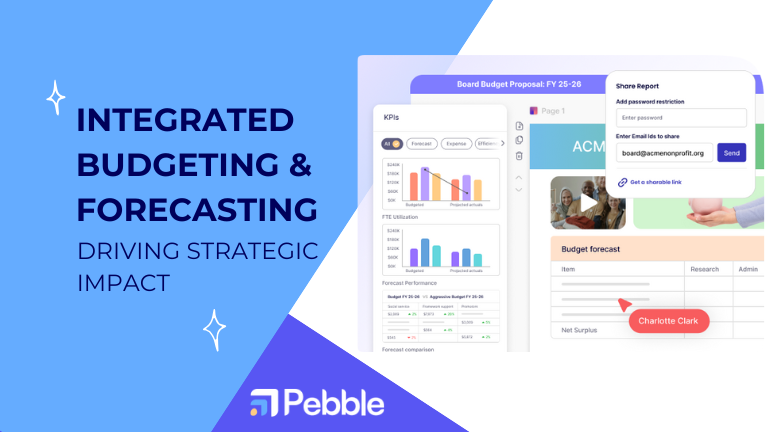
Now, Part 3 brings it all together: integrated budgeting & forecasting for nonprofits—one KPI spine across fundraising, finance, and programs, live grant spend-down, and automated reporting so meetings focus on decisions, not compilation.
1) One KPI spine: connect fundraising, finance, and programs
The pain: Siloed systems and spreadsheets force leaders to reconcile conflicting truths—fundraising trends here, program activity there, finance somewhere else. Time is lost reconciling, not deciding.
What “integrated” looks like:
- Single operating view of the few metrics that matter weekly: liquidity/runway, program pacing, donor retention, budget vs. actual, and head-level grant utilization.
- Shared definitions for KPIs so board, ED, finance, and program teams talk about the same numbers.
Actionable:
- Pick 6–8 leadership KPIs and keep them consistent across the year:
- Liquidity/Runway: Survival Ratio (Runway), Liquid Funds Indicator, Average Bank Balance
- Cost/Effectiveness: Supporting Services to Total Spend, Performance Summary
- Program View: Performance by Program
- Establish a weekly 20-minute review on the one KPI spine—no slide rebuilds.
- Keep a decision log linked to each KPI (what changed, why, what we’ll do).
The Platform Overview shows how Pebble’s KPI spine unifies fundraising, finance, and program indicators on one live canvas.
2) Grant spend-down in real time (by heads, not just GL)
The pain: Over/under-utilization against funder heads creates non-compliance risk and last-minute scrambles. GL-only views hide contract-head pacing.
What “good” looks like:
- Head-level pacing against time and deliverables for each active grant.
- Alerts before a head is over/under-utilized or timing slips.
- Pre-drafted plays (re-phasing, reclass, scope shifts) ready when thresholds trip.
Actionable:
- Inventory top grants and build forecast templates in contract heads (then map to GL).
- Add a pacing bar to each head (planned vs. actual) and an “evidence due” lane.
- Revisit fundamentals with: Grant Management Guide, Common Grant Management Challenges, and The Future of Grant Budgeting.
Pebble’s Grant Performance Tracking tracks spend-down at the head level with live utilization and alerts, so Program and Finance align on the same truth.
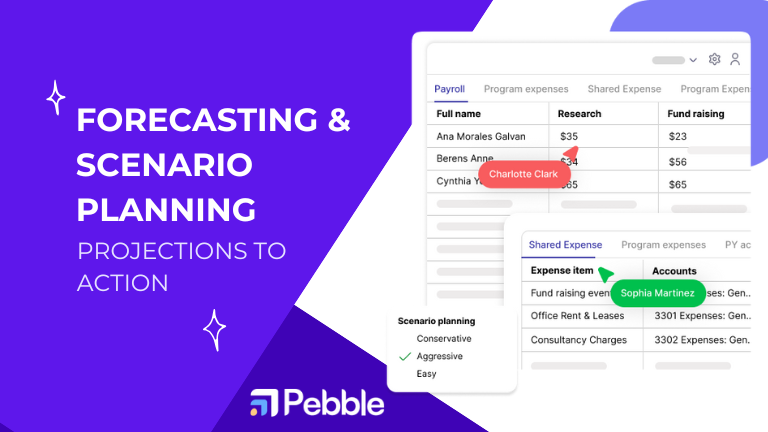
3) Rolling forecasts meet board-ready reporting
The pain: Month-end is a rebuild exercise. Data is stale by the time the board sees it. Scenario implications are buried in notes.
What “good” looks like:
- Forecasts refresh monthly, auto-rolling +12 months from “today.”
- Scenario bands (best/base/worst) visible on every board pack.
- Commentaries focus on what moved, why, and next decision.
Actionable:
- Standardize a 3-chart board pack:
- Rolling forecast with scenario bands,
- Grant spend-down by head/time,
- KPI spine with green/amber/red.
- Keep a 3-bullet commentary in each pack: movement, cause, action owner.
- Use these donor/ops resources to sharpen narrative: Build a Recurring Donor Base, Transparency Drives Retention, and Predictive Analytics.
Pebble’s Automate Financial Reporting and Pebble AI pull rolling forecasts/KPIs into board/funder-ready packets—so leaders discuss decisions, not spreadsheets.
4) Operating rhythm: decisions, not data wrangling
The pain: Teams spend cycles gathering and cleaning data; decisions wait.
Operating cadence (repeatable):
- Weekly (ops): 20 minutes on the KPI spine; confirm owners and deadlines.
- Monthly (finance+program): Refresh actuals → forecast; update scenarios; prep board pack.
- Quarterly (leadership): Portfolio look—program ROI/mission return, reserve policy check, funding diversification moves (Funding Diversification Strategies).
Actionable:
- Write a one-page “variance plays” policy (freeze tiers, re-phase rules, hiring gates).
- Track forecast accuracy and tune drivers (not just outputs).
- Keep the Nonprofit Blog hub handy for new KPI and grant playbooks: Pebble Nonprofit Blog.
5) Quick start checklist (90-day integration)
- KPI spine defined (6–8 metrics) and shared org-wide.
- Grant head templates created; pacing/alerts live.
- Rolling forecast (+12) on auto-refresh; scenarios tied to plays.
- Board pack standardized (3 charts + 3-bullet commentary).
- Decision log active; owners and due dates assigned.
Conclusion: integrated budgeting & forecasting for nonprofits
When integrated budgeting & forecasting for nonprofits are in place, leadership moves from reconciling data to running the plan: one KPI spine, head-level grant compliance, and board-ready reporting that’s always current. The payoff is fewer surprises, faster action, and stronger trust with funders, boards, and teams.
Ready to see this integrated workflow in action? Explore the Platform Overview or Request a Demo.