
Forecasts are where your budget becomes real-time strategy. For Executive Directors and Program Directors, nonprofit forecasting and scenario planning help you anticipate cash needs, protect program delivery, and give your board credible options before surprises hit. If Part 1 set the foundation, this guide turns projections into repeatable operating rhythm—tied to grants, programs, and KPIs.
If you’re catching up on the series, start with Mastering Nonprofit Budget Planning, then come back here.
1) Build a driver-based forecast (not a bigger spreadsheet)
What to model
- Revenue drivers: donor segments/renewals, average gift, grant conversion/renewals, earned-unit volumes.
- Expense drivers: FTE by program, unit costs, vendor rates, inflation, seasonal activity.
- Program drivers: beneficiary counts, service intensity, milestone cadence.
KPIs that keep leaders out of firefighting
- Liquidity & runway: Survival Ratio (Runway), Liquid Funds Indicator, Average Bank Balance
- Cost structure & effectiveness: Supporting Services to Total Spend, Performance Summary
- Program view: Performance by Program
Actionable
- Put 3 revenue + 3 expense drivers on page one of your model with plain-English assumptions.
- Add KPI tiles for runway, donor retention trend, and grant pacing.
- Revisit Part 1 tactics on aligning to mission: Budget Planning Guide.
2) Shift to a rolling forecast cadence
Static, annual projections go stale quickly. Rolling forecasts extend +12 months from ‘today’ and refresh monthly so you can adjust early.
Design principles
- Monthly buckets (not quarterly) for earlier signal detection.
- Fixed vs. variable split so you know what flexes under stress.
- Anchored to program calendars (cohorts/terms).
- Board-ready views with short commentary—decisions, not data dumps.
Related playbook
- Donor health as an input: Build a Recurring Donor Base, Transparency → Retention
- Forward-looking signals: Predictive Analytics for Nonprofits
Actionable
- Set a 12-month window; lock historicals; refresh actuals → forecast monthly.
- Add a 3-bullet commentary box: what moved, why, what we’ll do.
- Keep Part 1’s board KPIs consistent so trends are comparable month-to-month.
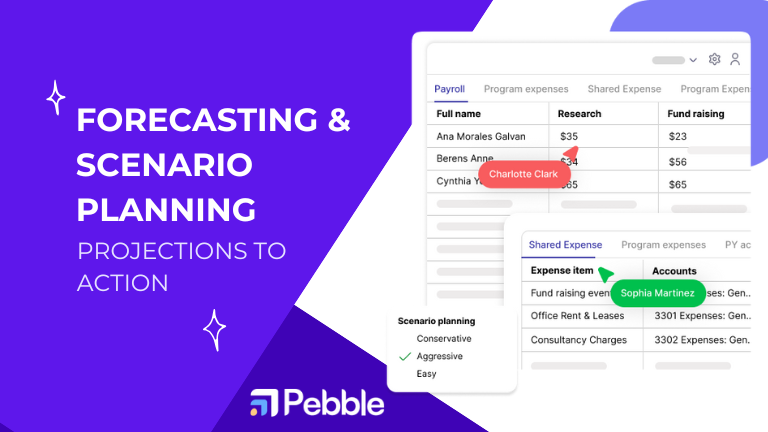
3) Scenario planning with pre-decided plays
Scenarios don’t predict the future; they pre-decide your moves when thresholds trip.
Build three cases
- Base: what you truly expect.
- Best: upside on key drivers (grant conversion, major gift, lower attrition).
- Worst: realistic shocks (grant delay, +10% cost, slower hiring).
Connect each case to plays
- Hiring gates (delay, stage, accelerate).
- Program throttle (expand cohort, defer launch, reduce scope).
- Non-program spend freezes by tier.
- Funder communications (mod requests, re-phasing). See Future of Grant Budgeting and Funding Diversification.
Actionable
- Pick 5 sensitive drivers; define ± bands (e.g., donor retention ±3 pts).
- Write the playbook under the chart (owner + trigger + timing).
- Review plays quarterly; keep the list short and repeatable.
4) Forecast grants in contract heads (then map to GL)
Grant terms rarely match your chart of accounts. Forecast and monitor in the same heads and pacing rules you report to funders; map to GL afterward.
How to operationalize
- Head-level spend-down pacing by time period.
- Evidence/deliverables sequenced with funding milestones.
- Modification scenarios drafted before you ask the funder.
Actionable
- Inventory heads for your top 5 grants; make a forecast template per grant.
- Add head-level alerts (over/under-utilization).
- Read the fundamentals: Grant Management Guide, Software vs. Spreadsheets, Common Challenges.
5) Reporting that drives action (not just compliance)
Your forecast matters only if leaders act on it.
Make it effortless and repeatable
- One screen for runway, variance hotspots, grant pacing.
- A standing board pack: 3 charts + one page of commentary.
- A simple decision log (plays approved, outcomes observed).
Actionable
- Lock a board report template now; only the numbers should change.
- Keep a weekly ED/FD/Program review on the same single view.
- Track forecast accuracy and tune the drivers, not just the numbers.
Helpful reads for narrative and speed
6) A 90-day rollout you can start today
- Days 1–30: Agree on drivers/KPIs; set rolling window; document assumptions; ship v1.
- Days 31–60: Add scenarios; wire monthly refresh; launch one-screen dashboard; run first board pack.
- Days 61–90: Add grant-head templates/pacing; create variance alert list; measure forecast accuracy; iterate.
Keep the Pebble Nonprofit Blog handy as your playbook hub.
Conclusion: from projections to decisions
The payoff of nonprofit forecasting and scenario planning is simple: fewer surprises, faster decisions, stronger trust. A driver-based model, refreshed monthly, linked to grant heads and KPIs—and backed by pre-decided plays—moves your leadership from reactive to proactive. In Part 3, we’ll connect these practices across fundraising, finance, and programs for an integrated operating system.
- See a forecasting walkthrough: Request a Demo
- Explore more planning playbook: Nonprofit Blog


.png)
